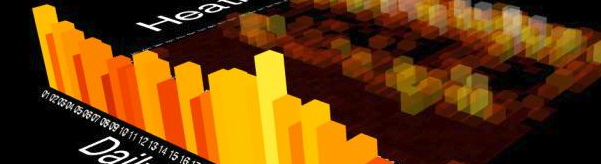
Smart meter data 3D heatmap

Part of an experiment in using three.js and color accessibility, this data visualisation offers an immersive 3D representation of smart meter over a month, allowing to feel the data in all its dimensions: hourly and daily variations, peaks and troughs of consumptions, anomalies and routines.

11 September 2019 · 1 min · Herve Senot

Wind farm 3D model

Part of an experiment in using three.js, this data visualisation recreates the layout of a Victorian wind farm, along with the terrain textured 4 ways (1 per season).

11 September 2017 · 1 min · Herve Senot

3D solar yield simulation

Part of a project for the Sustainable Energy Systems course at RMIT, this data visualisation quantifies the solar potential of an unusual roof configuration (a retirement home) by running irradiance simulation in the EnergyPlus engine, on a building envelope modelled in SketchUp.

11 September 2013 · 1 min · Herve Senot